Bitcoin Price Prediction: BTC/USD Continues to Downsize

Bitcoin Price Continues to Downsize – May 24
As it continues to downsize, the market operation of BTC/USD has continued downsizing most of the higher values obtained during successful bullish-run sessions. As of writing, the market’s lowering trade zone is now at around the level of $34,094 at an increase of about 0.80%.
BTC/USD Market
Key Levels:
Resistance levels: $40,000, $45,000, $50,000
Support levels: $30,000, $25,000, $20,000
BTC/USD – Daily Chart
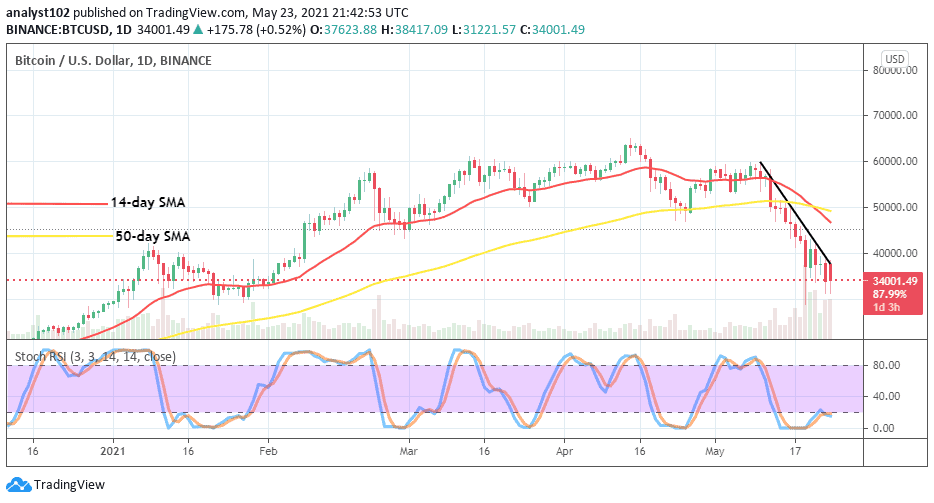
It is still indicated on the BTC/USD daily chart that the crypto market’s trend is in a strong bearish outlook. As a result the downsizing continues may have t prolong. From May 19th until the present, the levels of around $40,000 and $30,000 have been the key trading zones of the crypto market. The bearish trend-line is placed downward to mark the path-line from which the has been falling. The 50-day SMA indicator has been freshly crossed to the south by the 14-day SMA trend-line. The Stochastic Oscillators have slightly moved up in the oversold region to conjoin the hairs at range 20. That sounds like a light warning against the probability of getting to a huge downswing in the next operations.
What could stop BTC/USD from continuing to downsize?
The current downsizing move in the BTC/USD market activities is still on a higher note of precipitating as there has been no reliable buy signal free from being not fake at this moment. However, the trade support level of $30,000 will adjudge the probability of getting to see more downside while bulls slack in putting much-needed energy to pull up against any further downward forces around that point.
It is now obvious that most of the trading tools have confirmed that the current trend in the crypto-economy is in a downsizing moving manner . As a result, bears now have to be on the lookout for decent sell entries below the point of $40,000 especially, while a fake upswing is made. In the meantime, a sudden emergence of a full-body bearish candlestick against the market level at the $35,000 may add more in continuation of the bearish price movement of the crypto’s worth.
BTC/USD 4-hour Chart Continues to downsize
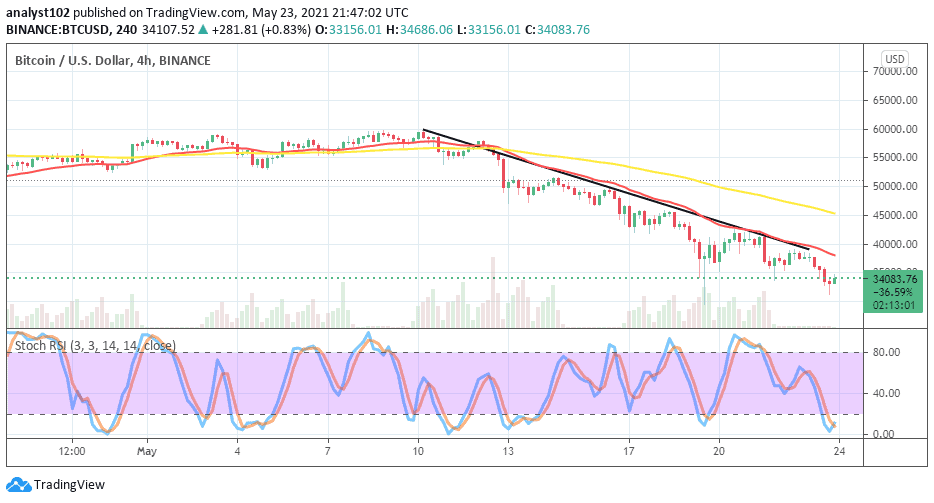
On the BTC/USD medium-term trading chart, the outlook still indicates that the crypto instrument continues to downsize in values as paired with the US fiat money. Both the smaller SMA and the bearish trend-line drew depressing over the market price to give a clear manner of how the crypto market responds positively to the downward pressure. The 50-day SMA indicator is located over the 14-day SMA trend-line pointing to the south. The Stochastic Oscillators are in the oversold region briefly pointing towards the north. It is being noticed that all of the upward moves made in this market got resisted at the touch of a point where both the bearish trend-line and the 14-day SMA are located paving ways far continued efforts to downsize. That said, the points between the $35,000 and the $40,000 now have to be on focus where such assumption is most likely to play out in continuation of the downsizing of values in the Bitcoin as traded against the US Dollar.

