Bitcoin Price Prediction: BTC/USD Trade Struggles Rebounding

Bitcoin Trade Struggles Rebounding – May 26
There has been a continual process that the BTC/USD trade struggles rebounding at the resistance level of $40,000. Price currently hovers at about the value of $39,813 with about 4.67% appreciation.
Trade Struggles Rebounding: BTC Market
Key Levels:
Resistance levels: $45,000, $50,000, $55,000
Support levels: $35,000, $30,000, $25,000
BTC/USD – Daily Chart
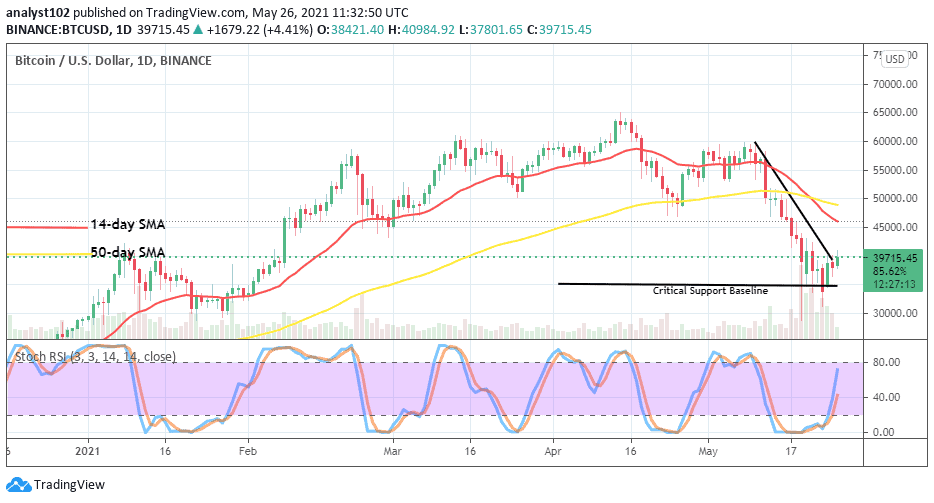
It is still now indicted on the BTC/USD daily chart that Bitcoin trade struggles to rebound further at the key resistance point of $40,000. The market level as earlier mentioned has appeared proven very difficult line retarding smooth further upswing in the BTC/USD trading operations. The bearish trend-line has not convincingly breached out northbound as it is closely drawn down to signify the point that the current rebounding movement has reached. The 50-day SMA indicator has been intercepted from the top by the 14-day SMA trend-line. And, they are above the bearish trend-line. The Stochastic Oscillators have swerved northwardly to place between the ranges of 40 and 80 to suggest an upward move is ongoing.
BTC/USD trade struggles rebounding , how long will it be?
As the Bitcoin versus USD trade struggles rebounding at one of the key resistance trading areas of $40,000, a candlestick is in the forming. And, until the end of today’s session, it may still be difficult to project a definite direction that price may make the candlestick to favor. With that said, it is most expectantly opined that it will be in line with the upside. In that way, bulls should be able to push the market further to break through some of the resistances. But, there may be a pit stop around the value of $45,000 afterward.
The present situation has seen the BTC/USD trade struggles rebounding, which has made it technically somewhat difficult for bears to stage a smooth sell entry. As a result, bears will now have to cautiously wait for a strong sell signal to resurface in this market. Following a price rejection at the level of $40,000 could in no time lead to caging most of the sell-trading positions in the process.
BTC/USD 4-hour Chart
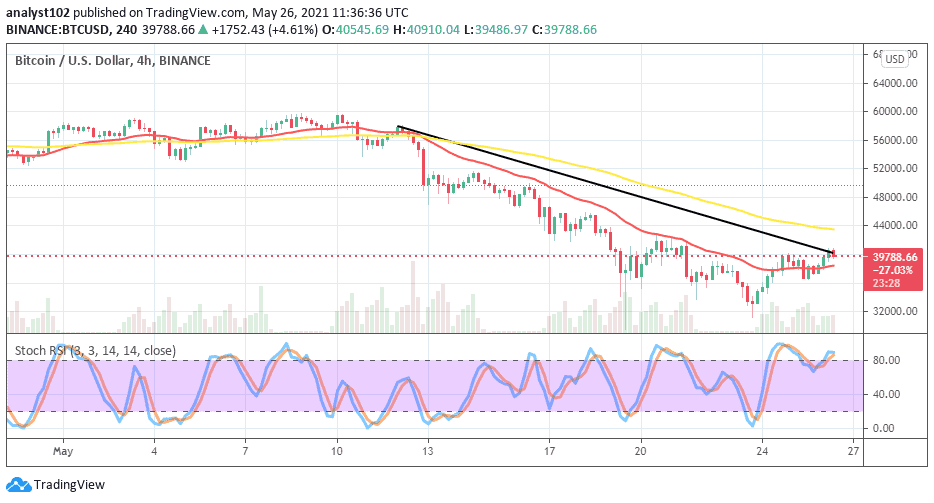
There has only been that Bitcoin and the USD trade struggles to rebound on a lighter note as depicted on the medium-term chart. The 14-day SMA trend-line has briefly traded past from the below as the bearish trend-line is located a bit over it placing a point at which the rebounding price reached. The 50-day SMA is situated above them bending toward the south. The Stochastic Oscillators are around range 80 and overbought region moving in a consolidation manner. They have now closed the hairs a bit over range 80. That suggests that the crypto market is in a less-active trading position. Therefore, indecision may now set in for a while.

