Bitcoin Price Prediction: BTC/USD Finally Trades Above $48,000

Bitcoin Price Prediction – August 14
The Bitcoin price prediction shows that BTC hits the major resistance level at $48,000 after touching $46,826 support.
BTC/USD Long-term Trend: Bullish (Daily Chart)
Key levels:
Resistance Levels: $52,000, $54,000, $56,000
Support Levels: $44,000, $42,000, $40,000
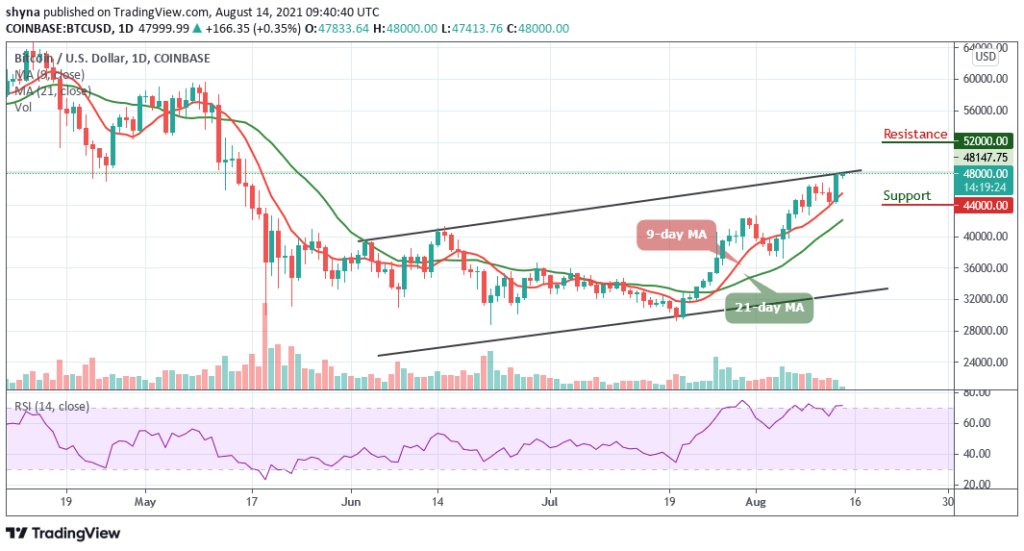
BTC/USD hits the price area around $48,000 after almost a weeklong of despairing trade. As the daily chart reveals that the coin is currently correcting upwards, we believe that the Bitcoin price is likely to cross additional resistances instead of just battling with inactive supports. At the moment, BTC/USD is seen touching the daily high of $48,000 after closing at $47,953 yesterday.
Bitcoin Price Prediction: Is Bitcoin Ready to Break Higher?
As the daily chart reveals, the Bitcoin price is seen making an attempt to cross above the upper boundary of the channel. The king coin may continue to head upward if the bulls stand firm within the market. Looking at the daily chart, BTC/USD is now trading above the crucial levels that will now function as the support zones in the event a reversal occurs.
Meanwhile, on the upside, as the bulls keep the coin above the 9-day and 21-day moving averages, little is in place to prevent correction targeting the key resistance of $48,200 as the technical indicator Relative Strength Index (14) remains with the overbought zone.
Nevertheless, as the coin faces the upside, the bulls may likely bank on the supports at $42,000, $40,000, and $38,000 to ensure that in spite of a reversal, the Bitcoin price stays above the $48,000 level. On the contrary, if the Bitcoin price crosses above the upper boundary of the channel, the nearest resistance levels could be located at $52,000, $54,000, and $56,000.
BTC/USD Medium – Term Trend: Bullish (4H Chart)
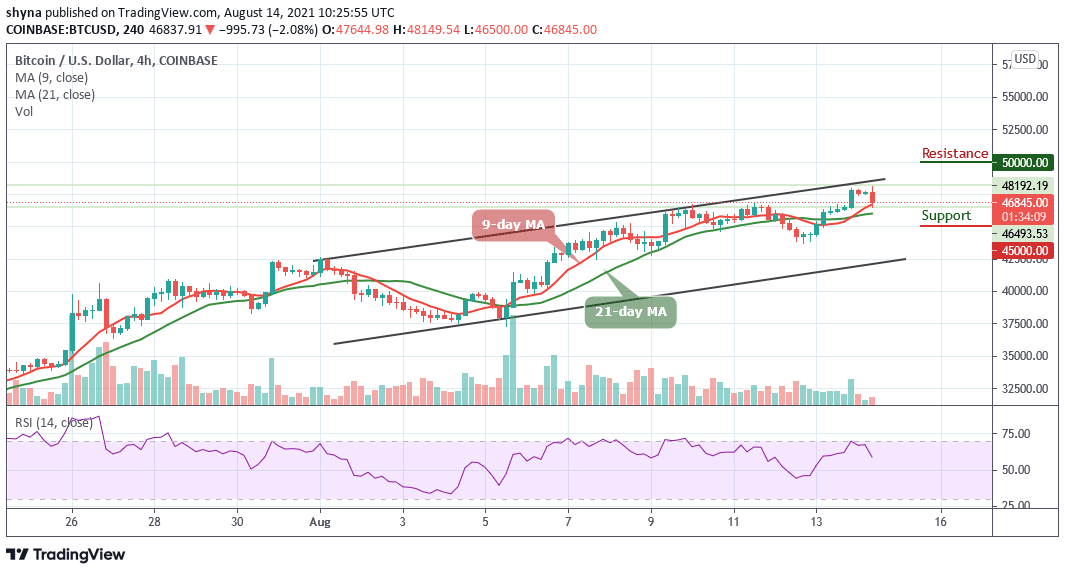
The 4-hour chart for BTC is showing a sign of a bearish trend since the daily opening. Although, the intraday trading is still looking bullish; following the recent rebound as the coin is now facing a key support level and the next key support level could be located at $45,000 and below.

However, considering the recent sharp drop, the Bitcoin price may continue the bearish rally to $46,000 support. In other words, a climb above the upper boundary of the channel may push BTC price to the resistance level of $50,000 and above. As it appeared now, it seems the bears may likely return to the market as the Relative Strength Index (14) nosedives below 60-level, suggesting bearish signals.
Looking to buy or trade Bitcoin (BTC) now? Invest at eToro!
75% of retail investor accounts lose money when trading CFDs with this provider

