Bitcoin Price Prediction: BTC/USD Trades Above $43,500

Bitcoin Price Prediction – September 30
The Bitcoin price prediction is showing stability above $43,000 as traders are waiting for another big move.
BTC/USD Long-term Trend: Ranging (Daily Chart)
Key levels:
Resistance Levels: $47,000, $49,000, $51,000
Support Levels: $38,000, $36,000, $34,000
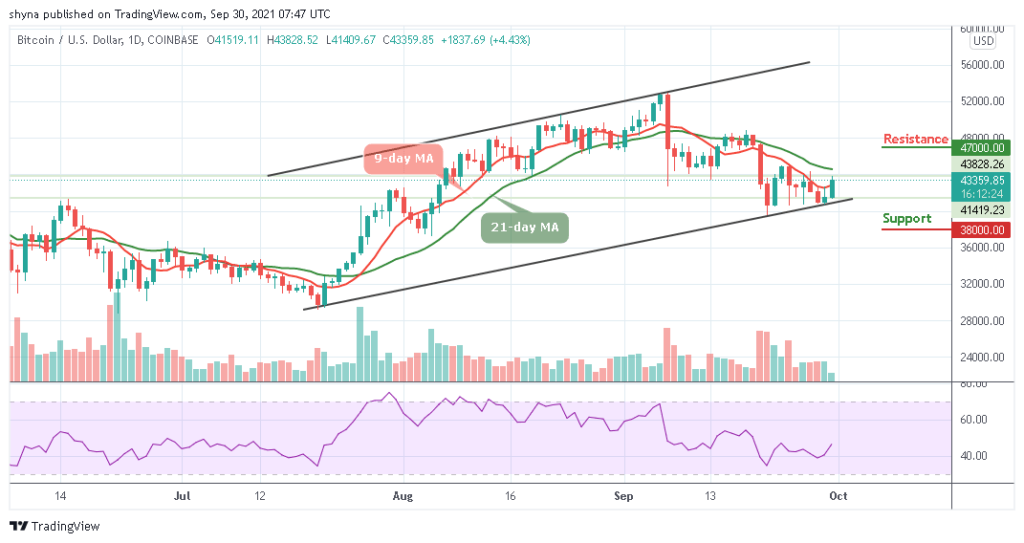
BTC/USD has been ranging between $41,000 and $44,000 for nearly a week after a shortfall from almost $44,366. Meanwhile, if the coin struggles to show a distinctive price movement, traders are generally wary of that movement. In the meantime, many traders expect the price of Bitcoin to recover and see the ongoing consolidation phase as a healthy pullback.
Bitcoin Price Prediction: BTC Price Ready for The Upside
At the moment, the Bitcoin price successfully stays above the $43,000 level and continues to trade above the 9-day moving average but still below the 21-day moving average. Recently, the coin even spiked to touch the daily high of $43,828 during the early trading session as the technical indicator Relative Strength Index (14) trades around 45-level.
At the time of writing, it seems like BTC/USD might stay clear of the gap, with the cryptocurrency trading under its recent resistance level of $45,000. Meanwhile, from a technical perspective, the king-coin has to fight off the first resistance at $46,000 before having a chance to aim at $47,000, $49,000, and $51,000 resistance levels. On the contrary, any bearish movement below the lower boundary of the channel may likely lead to the critical supports at $38,000, $36,000, and $34,000.
BTC/USD Medium – Term Trend: Ranging (4H Chart)
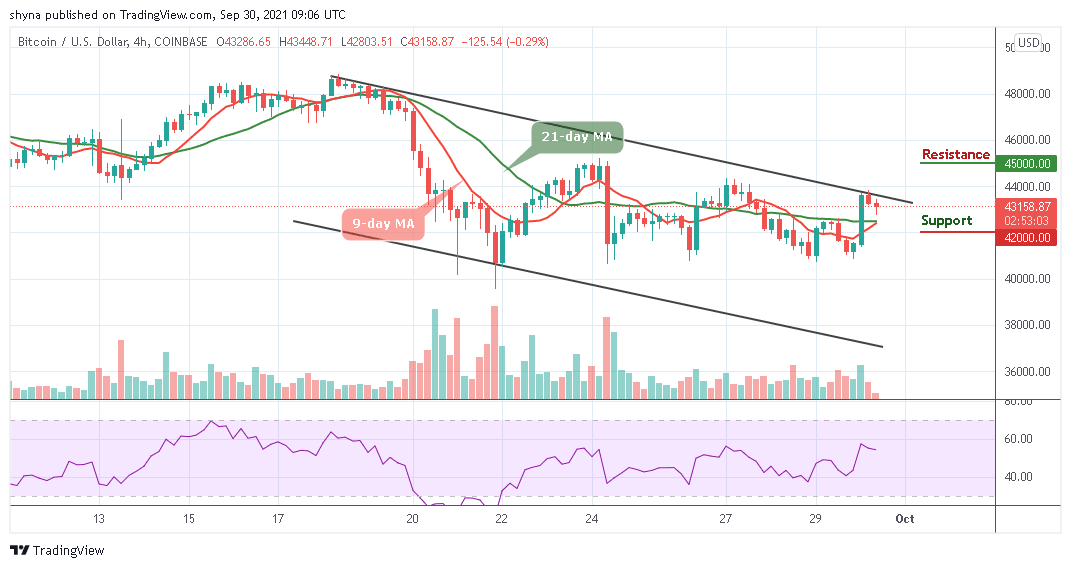
There are several signs that Bitcoin (BTC) is on the verge of a significant upward movement. However, the price action of the last few hours has formed a bullish movement on the 4-hour chart which appears to have erupted with a decent move towards $44,000. Likewise, the Relative Strength Index (14) is noticeably depressing, suggesting that high volatility could come into play.

In the meantime, the 9-day moving average attempts to cross above the 21-day moving averages, and additional resistance levels may be reached. However, a move above the $44,000 level with a strong close above it may likely push the Bitcoin price up to the resistance level of $45,000 and above while the support level is located at $42,000 and below.
Looking to buy or trade Bitcoin (BTC) now? Invest at eToro!
67% of retail investor accounts lose money when trading CFDs with this provider
Read more:

