Bitcoin (BTC) Price Prediction: BTC/USD Fluctuates Between $60k and $63k, Larger Move Is Likely

BTC/USD Is Unable to Sustain Above $63k, Larger Move Is Likely – October 31, 2021
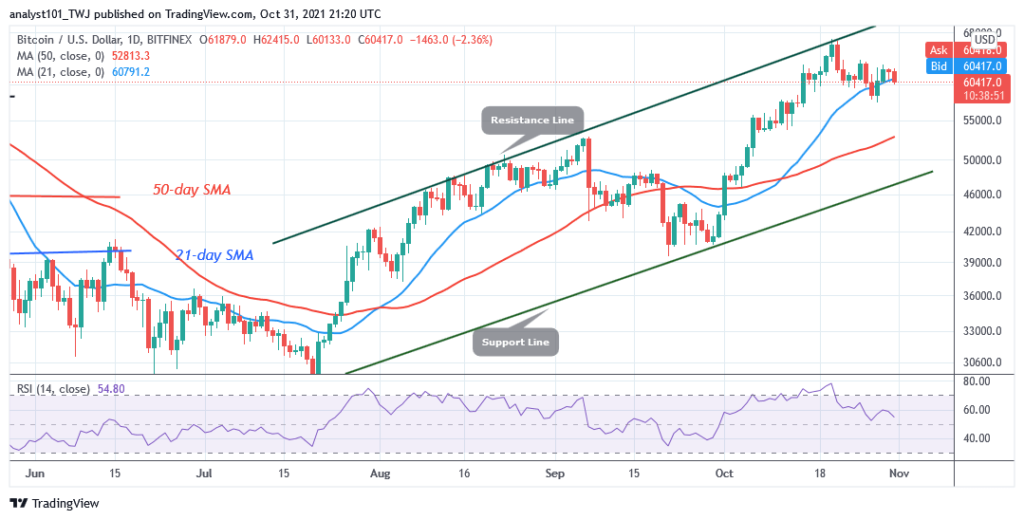
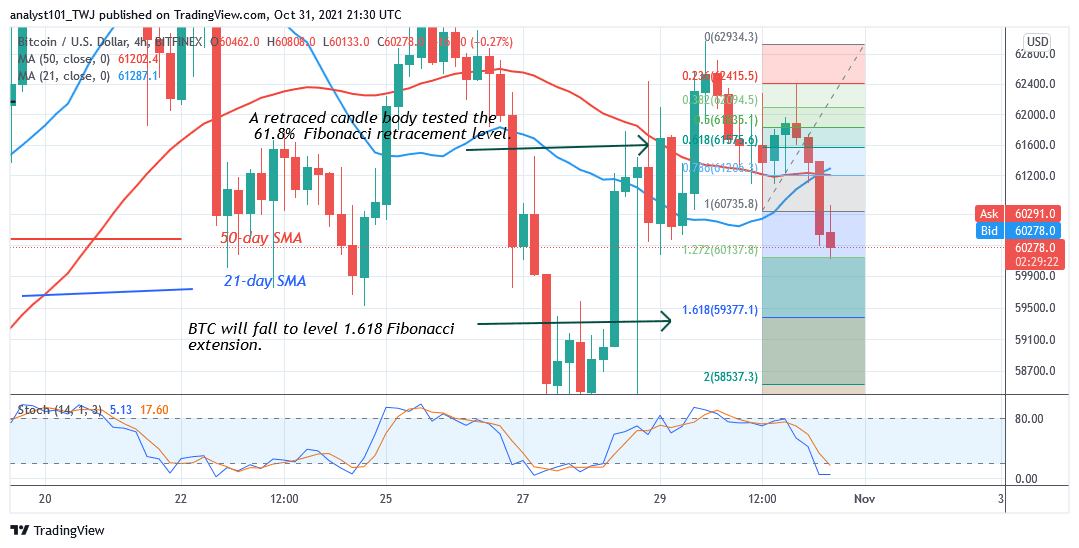
BTC prices will continue to rise as long as Bitcoin trades above the moving averages. In other words, the market will rise if the price remains above the 21- day line moving average. Today, BTC prices are fluctuating below the $62,000 resistance zone. However, before I could take the next sentence, Bitcoin has fallen to the support above the $60,000 price level. The bears have retested the current support several times. In the same vein, buyers are finding penetration difficult at the $63,000 high. The bottom line is that Bitcoin is range-bound between $60,000 and $63,000 price levels. Bitcoin will resume upside momentum when the resistance levels of $63,000 and $64,000 are breached.
Bitcoin (BTC) Indicator Reading
The cryptocurrency is at level 54 of the Relative Strength index period 14. Bitcoin is in the bullish trend zone and above the centerline 50. The king coin has enough room to rally on the upside. Majorly, BTC price bars are above the 21-day line and the 50-day line moving averages which indicate further upward move. The crypto is below 40% area of the daily stochastic. Bitcoin is in a bearish momentum.

Meanwhile, for the past week, BTC/USD has been fluctuating between $60,000 and $63,000 as as larger move is likely. Bitcoin’s upward move has been stalled at the recent high. The cryptocurrency will trend when the range-bound levels are breached.
Looking to buy or trade Bitcoin (BTC) now? Invest at eToro!
68% of retail investor accounts lose money when trading CFDs with this provider
Read more:
• How to buy Bitcoin
• How to buy cryptocurrency

