Bitcoin (BTC) Price Prediction: BTC/USD Slumps Below $60,000 Support as Bears Overwhelm Bulls

Bitcoin (BTC) Price Prediction – April 10, 2021
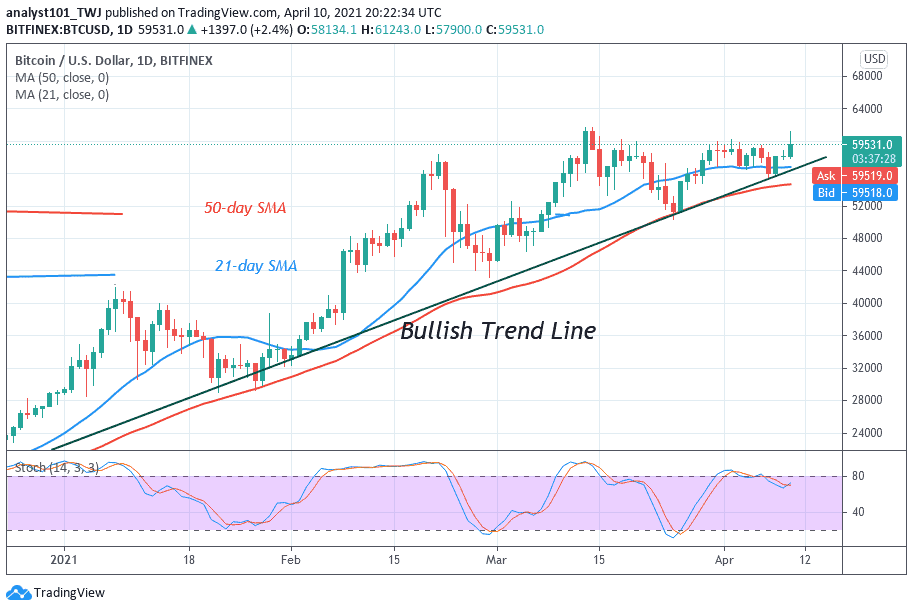
BTC/USD made positive moves above the $60,000 overhead resistance as price reached a high of $61,243. Unfortunately, buyers could not sustain the bullish momentum above the overhead resistance. Today, BTC price has fallen below the $60,000 support. A further downward movement of the coin is likely.
Resistance Levels: $58,000, $59,000, $60,000
Support Levels: $40,000, $39,000, $38,000
Today, BTC price broke the $60,000 overhead resistance as price reached the high of $61,243. In previous price actions, buyers broke the overhead resistance on two other occasions. On March 14, the bulls broke the psychological price level as price rallied to $61,699 high. On April 2, buyers also made concerted efforts to break the resistance but the market reached a high of $60,190. One common feature in the price action is that buyers failed to sustain the bullish momentum above the overhead resistance. Meanwhile, Bitcoin has fallen to $58,450 low and pulled back. The bottom line is that if the bears break the $58,000 support, the market will further decline to $54,000 low. On the other hand, if the $58,000 supports holds, Bitcoin will resume upside momentum.
HSBC Blacklists Microstrategy’s Stock for Investing In Bitcoin
HSBC is an investment banking giant that has classified MicroStrategy as a “virtual currency product.” HSBC has directed users that already own MicroStrategy stock not to buy additional shares. According to reports, buying MicroStrategy stock is no longer possible for HSBC customers on the bank’s online trading platform — HSBC InvestDirect or HIDC. The message from the banking giant includes the following: “HIDC will not participate in facilitating (buy and/or exchange) products relating to virtual currencies, or products related to or referencing to the performance of the virtual currency.” The reason for the blacklisting is that MicroStrategy is a virtual currency product.

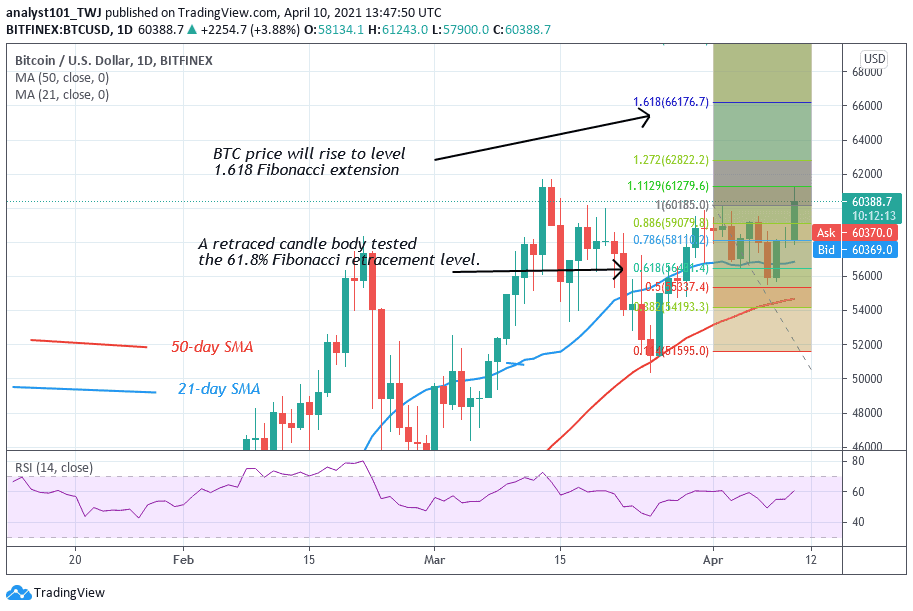
Bitcoin has fallen after breaking the overhead resistance. Meanwhile, the upside momentum will resume if the BTC price retraces and finds support above the $58,000 support. Nevertheless, the Fibonacci tool has indicated an upward movement of price. On April 2 uptrend, a retraced candle body tested the 61.8% Fibonacci retracement level. This retracement gives the impression that BTC price will rise to level 1.618 Fibonacci extension or the high of $66,425.90.

