Bitcoin (BTC/USD) Market Features Lower Above $40,000

Bitcoin Price Prediction – September 26
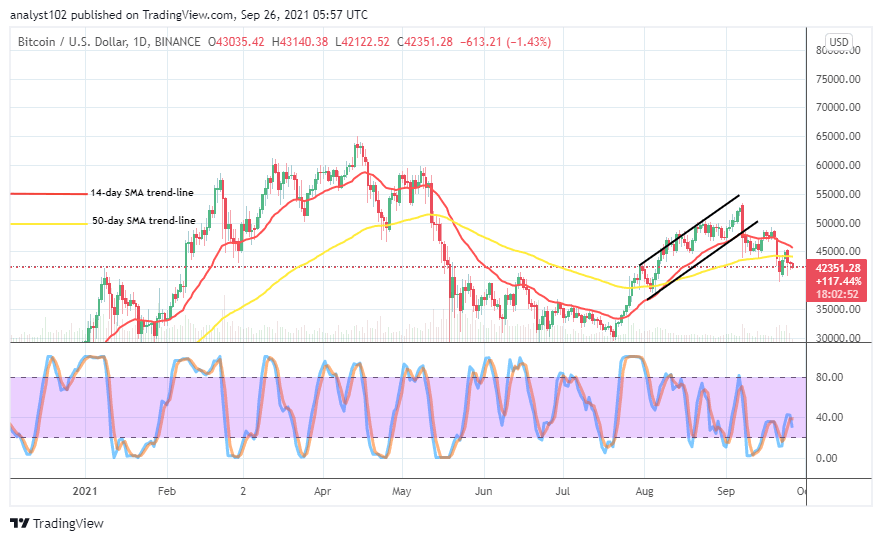
The BTC/USD market now features lower a bit above the level of $40,000 as there has been a heightening of valuation retracement in the crypto economy. The trade-lowering rate is around -1.43 percent, trading around the line of $42,351 as of writing.
BTC/USD Market
Key Levels:
Resistance levels: $45,000, $47,500, $50,000
Support levels: $40,000, $37,500, $35,000
BTC/USD – Daily Chart
The BTC/USD daily chart showcases that the crypto market features lower above the line at $40,000. During the September 21st trading operation, the market moved downward tightly, trading around the point mentioned. The 14-day SMA trend line is above the 50-day SMA trend line, trying to bend southward at a mere close range. The Stochastic Oscillators are swinging around the range lines of 40 and 20 to signify that the crypto trade activities are firm in the range lines of $45,000 and the lesser point mentioned earlier.
|
Will the breaking of $40,000 signify a stable return of bearish trend as the BTC/USD market features lower above it?
The breaking down of the $40,000 line may not be stable for a long time as there has been a heightening of retracement movement in the BTC/USD price valuation as the market features lower above the point. It will be a great advantage to get reliable support while price moves against the value line in the subsequent more active trading situation. Therefore, bulls may have to be on the lookout for that scenario to play out before launching a buy order.
On the downside, the BTC/USD market bears now have the $45,000 level as the timely trading zone that selling force may re-feature in their favor. The interception of the 50-day SMA indicator by the 14-day SMA indicator from the top will portend a clear picture that the downward force will dominate the market furthermore for a specific short time.
BTC/USD 4-hour Chart
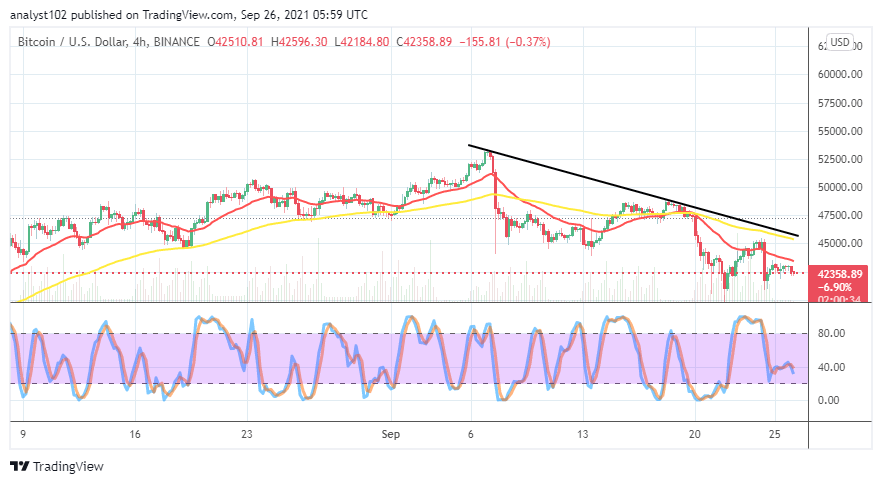
On the BTC/USD 4-hour chart, it depicted that the market’s trend has been bearish over a couple of sessions. The crypto-economic market features lower beneath the trading indicators. The 50-day SMA trend line is over the 14-day SMA trend line as the bearish trend line drew above them, aligning with the actual points that the market keeps to the downside path. The Stochastic Oscillators have conjoined and crossed southbound at range 40, briefly pointing to the south. That indicates that the selling-off situation is still imminent. Therefore, Long-position takers may still need to be patient for a while.
Looking to buy or trade Bitcoin (BTC) now? Invest at eToro!
67% of retail investor accounts lose money when trading CFDs with this provider.
Read more:

