Bitcoin (BTC/USD) Price Drops, Touching $40,000 Psychological Spot

Bitcoin Price Prediction – February 19
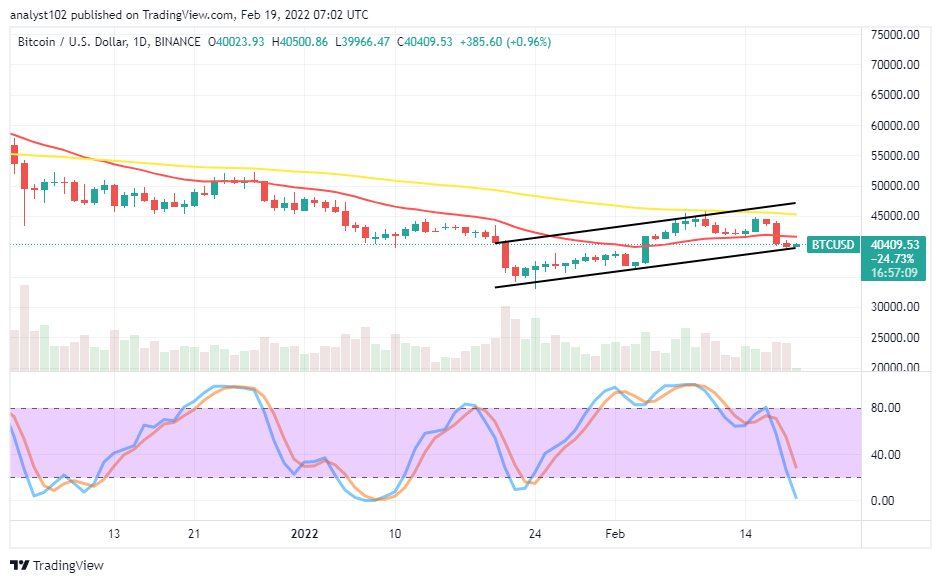
The BTC/USD price drops to touch the $40,000 psychological spot that may not be easily breach southward further in the near time. The crypto economy now trades around $40,409 between the high and low values of $40,500 and $39,966, maintaining a minute positive percentage of about 0.96.
BTC/USD Market
Key Levels:
Resistance levels: $42,500, $45,000, $47,500
Support levels: $37,500, $35,000, $32,500
BTC/USD – Daily Chart
The BTC/USD daily chart reveals the crypto-economic price drops, touching the $40,000 psychological spot. There is a smaller bullish candlestick in the making around the lower bullish channel trend line. The 14-day SMA indicator is underneath the 50-day SMA indicator. The Stochastic Oscillators are attempting to dip into the oversold region. That gives a signal against holistically relying on pushing alongside with current slight upside momentum.
Will the BTC/USD market moves northward as the price drops, touching the $40,000 psychological spot?
The present BTC/USD market trading condition appears getting prepared to break down through some supports in a slow-and-steady moving manner as the crypto-economic price drops to touch the $40,000 psychological spot. For the time being, a necessary rebound may have to occur to give a chance for a short-term buying spree for a while.
On the downside of the technical analysis, the rebounding trend seems to be in place as price tends to keep within the channels for some time more. Some forces needed to garner at a higher trading resistance zone to let bears regrow energy to push back the market into a downward trend. A sudden fearful move needed to emerge against the $40,000 psychological level to confirm the bearish trading has returned.
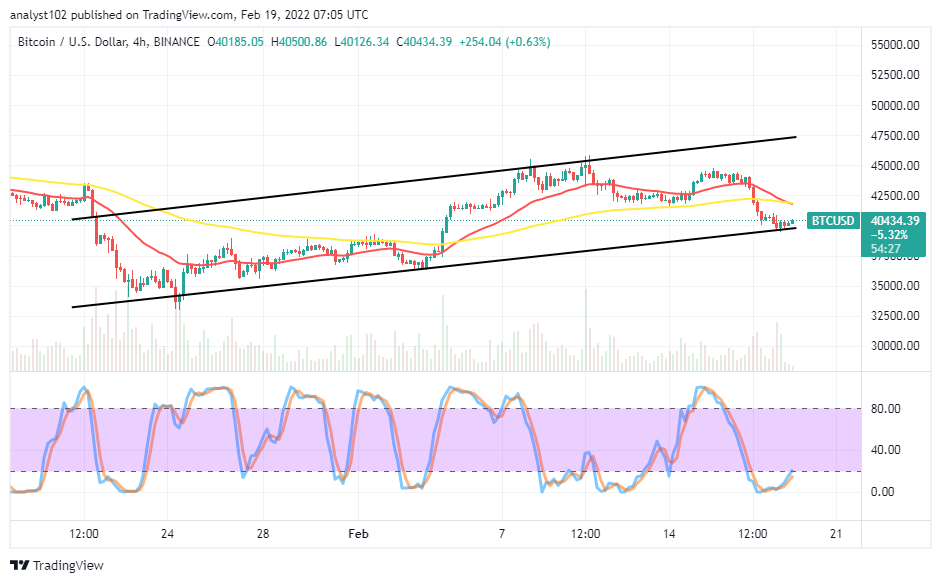
BTC/USD 4-hour Chart
The BTC/USD medium-term chart showcases the crypto-economic drops, touching the $40,000 psychological support spot around the lower bullish channel trend line. The 14-day SMA indicator has bent southward to touch the 50-day SMA indicator at the top. The Stochastic Oscillators are in the oversold region, trying to cross northbound closely beneath the range of 20. That signifies the potency of seeing the price resuming another round of rebounding process. Shorting positions around the value line seem not technically ideal presently as there can be a bouncing-off in no time.
Looking to buy or trade Bitcoin (BTC) now? Invest at eToro!
68% of retail investor accounts lose money when trading CFDs with this provider.
Read more:

