Bitcoin (BTC/USD) Pushes Southbound Further

Bitcoin Price Prediction – June 21
There has been a continuation in the recent pressures of BTC/USD as the market pushes southbound further to average the support of $30,000. The crypto sees a percentage rate of about -6.00 to trade around the value of $32,974.
BTC/USD Market
Key Levels:
Resistance levels: $35,000, $40,000, $45,000
Support levels: $30,000, $25,000, $20,000
BTC/USD – Daily Chart
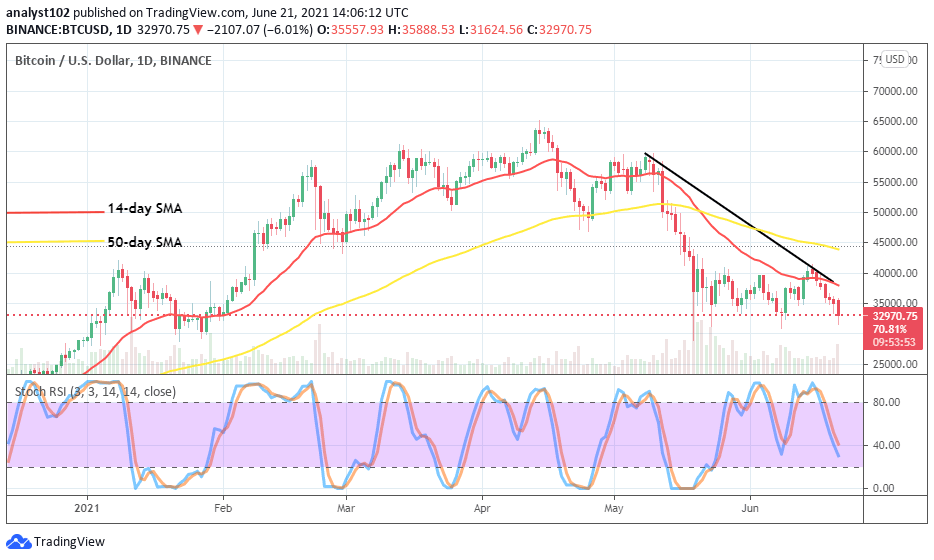
On the BTC/USD daily chart, a candlestick now pushes southbound further to denote a bearish trend commencement of the market. The 50-day SMA indicator is located above the 14-day SMA trend-line as the bearish trend-line drew downward across the SMA trend lines to the south. The Stochastic Oscillators are still pointing toward the south near above range 20. The crypto’s market value now appears under falling pressures as the downward-pointing stance of the capacity-weight assessing indicator has portended.
As there have been pushes southbound further, could there be a bearish trend continuation?
The market operation between Bitcoin and the US Dollar now pushes southbound further to approach the smaller support value of $30,000. Being as it is, the downward forces are still much in focus as presently indicated by the Stochastic Oscillators. A bullish candlestick is now much needed to emerge from the dip trading spot of the market before a decent buy order could be achieved.
Breaking of the market level at $35,000 has now given bears a better chance of shorting positions while the market reverts several pulling ups that price tends to be making. The eventual closing of the Stochastic Oscillators’ lines will potentially signal an in-active trading position for the pair. Reversal of pull-ups may be observed around the resistance level of $35,000 at a later session if the downward trend has to continue. Further downward breaking of the support line of $30,000 may not be obtained in the near session.
BTC/USD 4-hour Chart
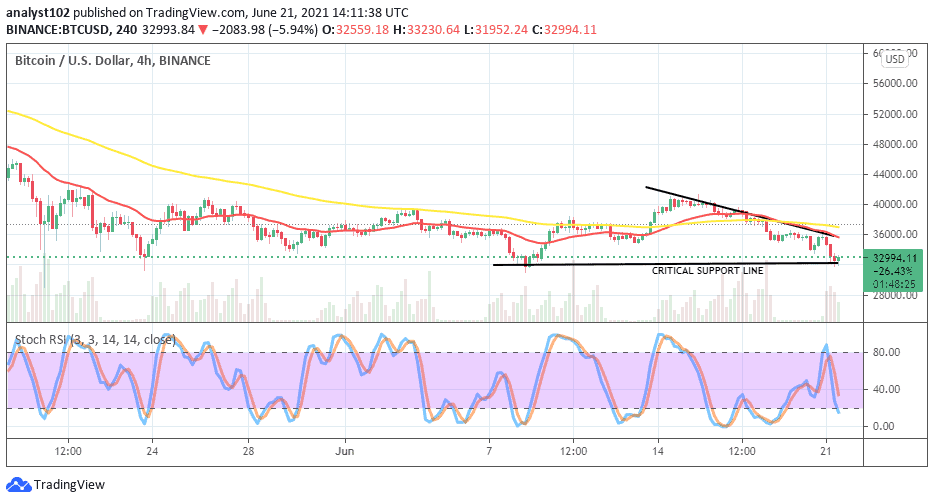
On the BTC/USD medium-term chart, the critical support line has featured around the level of $32,000 as a line of bearish candlesticks has formed to touch it at the lower zone. The 50-day SMA indicator has been intercepted by the 14-day SMA trend-line from the top. And, the bearish trend-line drew across them tightly alongside with the smaller indicator. The Stochastic Oscillators have moved to the downside. Equally, price pushes southbound. There may soon be a way to push south further slightly to find support a bit below the market level mentioned earlier.
Looking to buy or trade Bitcoin (BTC) now? Invest at eToro!
75% of retail investor accounts lose money when trading CFDs with this provide

