Bitcoin (BTC/USD) Swings Northbound Slightly

Bitcoin Price Prediction – June 16
The financial record of trade operation featuring between Bitcoin and the US Dollar presently swings northbound slightly at the upper range-bound trading zone of $40,000. Price, as of writing, trades around $40,197aat a percentage rate of about 0.45 increases.
BTC/USD Market
Key Levels:
Resistance levels: $45,000, $55,000, $60,000
Support levels: $35,000, $30,000, $25,000
BTC/USD – Daily Chart
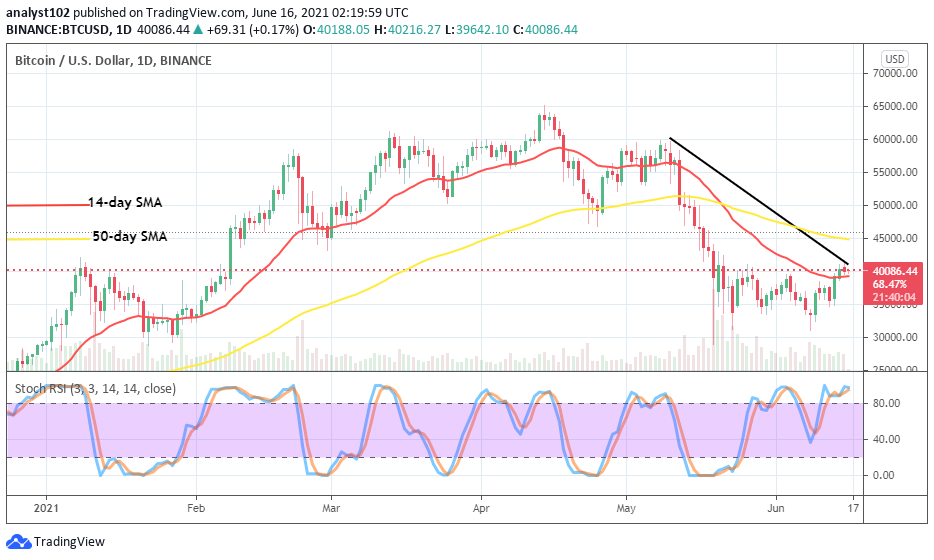
It is now depicted on the BTC/USD daily chart the smaller SMA has from June 14 been seeing a formation of smaller candlesticks appearing on its buy signal side around the level of $40,000. In other words, there have been price swings northbound slightly in the crypto economy. The bearish trend-line drew across the 50-day SMA indicator from the top to mark the point at which the current price has pushed a bit over the 14-day SMA trend-line. The Stochastic Oscillators are in the overbought region seemingly appeared to have begun a consolidation moving manner in it to suggest the probability of seeing more smaller ups and downs in continuation around the market value of $40,000 in the next trading activity.
Slightly swings northbound, will the BTC/USD price go up furthermore?
The probability the BTC/USD market swings northbound further away from the level of its recent long-resisting area of $40,000 appears not releasable in the short-term run of the operations. However, a sudden aggressive bullish move could potentially propel the market direction into a stable higher position of trading from that zone. At this point, intending investors may consider joining the market now as it could still be one of the best investment sessions currently.
On the downside, the points of $40,000 and $45,000 now seem to be decent points that bears needed to make a stronghold of their stances in the market. The latter price value earlier mentioned happens to be the most likely trading area that a pit stop will be experienced after a long-struggling of pushes. Being as it is currently, there has been no strong signal to exert a sell positioning of trading in the BTC/USD market.
BTC/USD 4-hour Chart
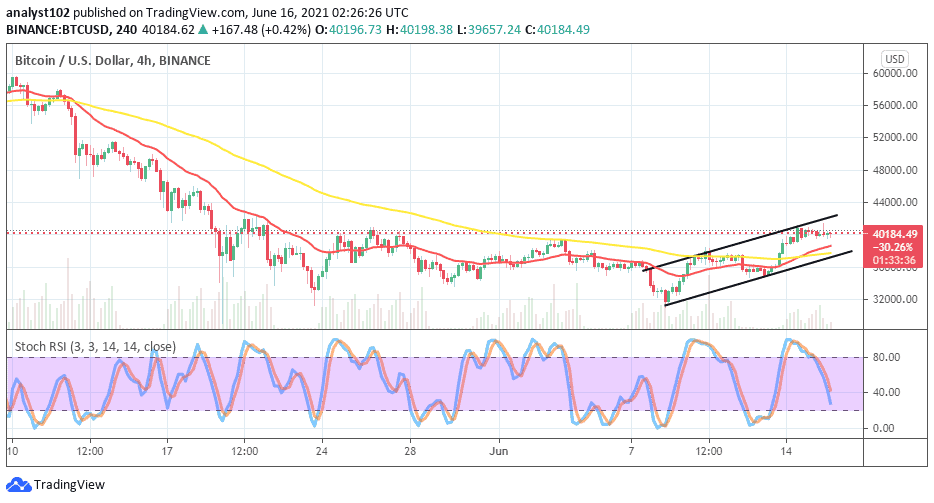
Bullish channels have now drawn on the BTC/USD medium-term chart to indicate a relative increase in the valuation of the crypto that is ongoing gradually. The channels’ paths now have around $38,000 and $44,000 trading zones to feature the market swings northbound in the meantime. The 50-day SMA indicator has been intercepted by the 14-day SMA trend-line from below at a close area a bit over the lower bullish channel path. The Stochastic Oscillators have swerved the lines southbound to locate a position in between ranges of 20 and 40. A cross back of the lines to the north slightly may be seen in no time. Therefore, some more light upswings may feature in this market for a while.
Looking to buy or trade Bitcoin (BTC) now? Invest at eToro!
75% of retail investor accounts lose money when trading CFDs with this provider

