Bitcoin Price Prediction: BTC/USD Downsizes Against $35,000 Level

Bitcoin Price Prediction – June 7
The aftermath consequent range trading situation between Bitcoin as paired with the US Dollar has currently led the crypto market to downsize against the $35,000 level. Price is now trading around $34,587 at a reduction of -3.60 percent.
BTC/USD Market
Key Levels:
Resistance levels: $40,000, $45,000, $50,000
Support levels: $30,000, $25,000, $20,000
BTC/USD – Daily Chart
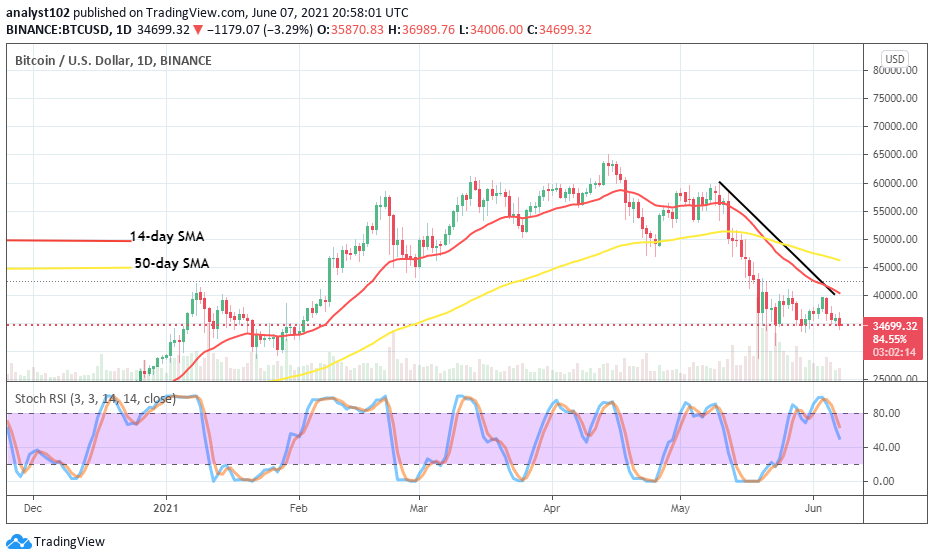
The BTC/USD chart shows that the recent lower trading zone currently witnessing the crypto market downsizes against $35,000 level to the south. Today’s session now appears with a higher falling pressure that has put the market on the verge of getting to see lower values. The bearish and the 14-day SMA trend-line are located underneath the 50-day SMA indicator. The Stochastic Oscillators have crossed southbound from the overbought region to point south-direction in support of the current ongoing sell-off of the crypto trade situation.
The current downsizes against the $35,000 level, could it push further into bearish trend resumption?
There is every tendency of seeing the BTC/USD market downsizes against the $35,000 level while bulls fail to hold their stance against the current pressure inflicted on the market by the US Dollar. A sustainable forceful breakdown of the point is most needed to be able to have a clearer picture in confirmation of that technical assumption. In the course of that presumed scenario, bulls are enjoined to patiently wait for either a notable price reversal movement or a formation of a bullish candlestick stemming up from a dip trading zone of the market afterward.
The breaking down of the lower point of $35,000 may potentially on a gradual moving mote put the crypto further under variant falling pressures. The Stochastic Oscillators’ southbound crossing averaging range 40 signifies that a degree of tangible selling pressure is ongoing. As a result, traders needed to have taken an advantage of the market to have entered a sell order position earlier around the mid-point of the recent lower range market level.
Looking to buy or trade Bitcoin (BTC) now? Invest at eToro!
BTC/USD 4-hour Chart
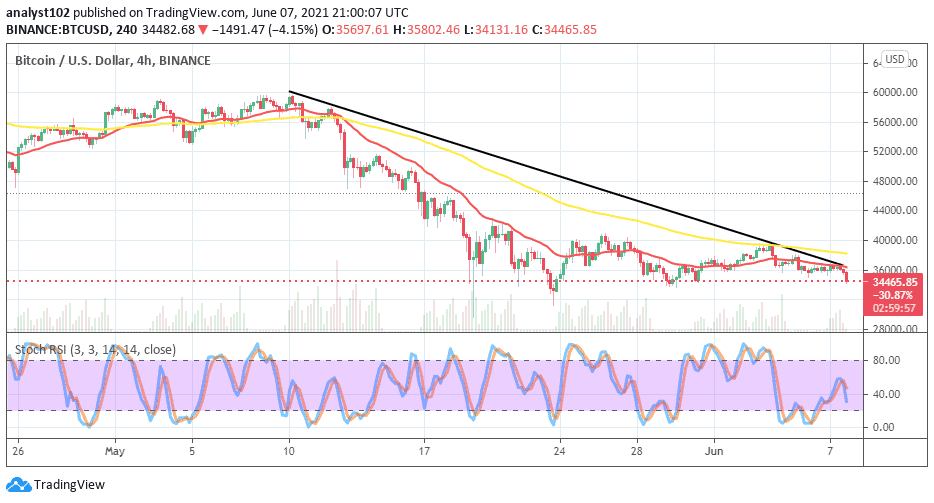
On the medium-term chart, the BTC/USD market’s price downsizes against its main lower range trading level of $36,000 as the $40,000 upper range line is now seen above all the SMAs. The bearish trend-line moved down across the 50-day SMA indicator to closely place near over the 14-day SMA trend-line at the point of current active falling forces of the market. The Stochastic Oscillators have crossed the lines southbound briefly past range 40 to signally back the possibility of seeing the drawdown move getting strengthened. At this point, all buying sentiments may have to be suspended for a while. But, on the contrary, A strong reversal bearish move against the level of $36,000 may in most cases signify a return of an upward move to decimate the present downward force.
75% of retail investor accounts lose money when trading CFDs with this provider

