Bitcoin Price Prediction: Crucial Pattern Spells Doom, $56K Vital For BTC
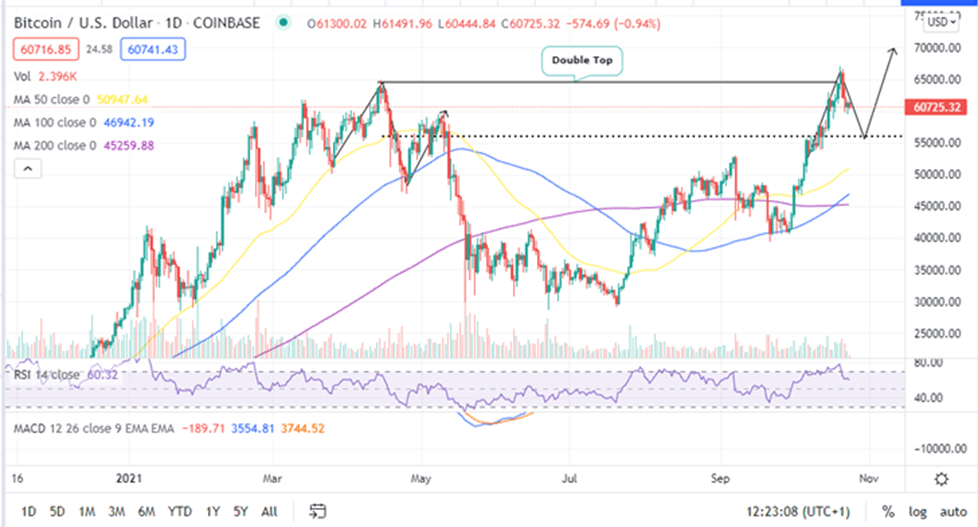
  • Bitcoin price action looks scary as it spells out a double-top pattern on the daily chart.
  • The largest cryptocurrency is now exposed to a downside target of $56, 000.
  • IntoTheBlock’s IOMAP model suggests that the BTC is sitting on strong support around the $56,000 support zone.

Bitcoin price is currently exchanging hands 9% lower than the recently recorded all-time high (ATH) above $67,000. Retracement appears quick and sharp as seen on the daily chart probably due to seller congestion near the ATH. It could also be that investors took advantage of the recent bull run that the crypto market has experienced since the beginning of “Uptober” to collect their profits.

At the time of writing,  BTC was trading at $60,725 while sitting on immediate support around $59,900. Note that a daily closure below this level  will see the Bitcoin price breakout downwards as sellers target $56,000.

Bitcoin Price Could Tank To $56K If Key Technical Pattern Holds

BTC appears to be forming a double-top pattern on the daily chart after being recording the ATH at around $67,276. A double-top is an exceptionally bearish chart pattern that often results in a trend reversal.

Bitcoin Price Daily Chart. Source: Tradingview

The bearish thesis is validated by a number of technical crypto signals. These include the appearance of a sell Bitcoin signal, that occurred when the MACD line crossed below the signal line on the daily chart. Moreover, the appearance of a bearish engulfing candlestick and the movement of the RSI away from the overbought zone in the exact daily time frame validate this pessimistic outlook.

BTC Unlikely To Go Below $56,000

On-chain metrics from IntoTheBlock’s IOMAP model indicates that the Bitcoin is likely to hold above the $56,000 support wall. This support zone is within the $55,277 and $57,104 price range where approximately 1.17 million addresses previously bought roughly 633,870 BTC. Such support is robust enough to absorb most of the selling pressure, allowing bulls to focus on pushing the price higher.

Bitcoin IOMAP Chart

Bitcoin IOMAP Chart
Bitcoin IOMAP Chart by IntoTheBlock

Lack of robust resistance on the upside shows that the Bitcoin price could have a smooth recovery. A daily close above the $61,000 psychological level and eventually a break above $62,000 will invalidate the bearish thesis fronted by the double-top pattern, propelling BTC significantly above $63,000.

Until the big crypto is able to break above this level, it may continue to consolidate until additional directional bias is revealed.

Looking to buy or trade Bitcoin (BTC) now? Invest at eToro!

Buy Bitcoin Now

67% of retail investor accounts lose money when trading CFDs with this provider


Read More

Please enter CoinGecko Free Api Key to get this plugin works.